
Chapter 4 of 51 · Reassessing the Presidency: The Rise of the Executive State and the Decline of Freedom by John V. Denson
1 Rating Presidential Performance Richard Vedder and Lowell Gallaway
Politicians crave to be president of the United States for a variety of reasons. Presidents are guaranteed a comfortable life of moderate affluence, as they usually are able to command a lifetime income of millions of dollars in book royalties, lecture, and corporate director fees after leaving office. A president has a great deal of power and derives satisfaction from being the most important person in the country, if not the world. Yet there is a third form of compensation that is particularly alluring: the chances of receiving eternal recognition in the history books. The reputation of chief executives with historians, political scientists, and other presidential scholars is important in defining a president’s long-term legacy. Thus several presidents have taped their office conversations with a view of improving their post-presidential standing. Dick Morris, sometime adviser to President Bill Clinton, suggested in his lively account of his years advising Clinton that the president was particularly attentive and interested in discussions of his longer-term historical reputation.[1] In their conversations with aides and friends, presidents as diverse as Harry Truman and Richard Nixon made frequent references to the presidency in a historical context.[2] Like his predecessors, Bill Clinton thought of his role in history with nearly every move he made, and in that he was hardly unique.
Statist Behavior and Presidential Reputation: A Hypothesis
Thus modern presidents not only try to appeal to voters, but to the constituency of historians and other presidential scholars who are influential in interpreting the presidency in future years. It is our thesis that these scholars generally are dependent on government for their income and tend to be sympathetic to an expansive role for the state. Most are politically liberal in the modern American sense of that word. To persons with this perspective, a “good” president is one who actively uses the powers of the American federal government, while a president who curtails the state and allows markets greater primacy in the allocation of resources and the distribution and creation of income is considered lackluster or mediocre.
This hypothesis is to some extent testable. There have been a number of surveys of presidential scholars asking them to rank the presidents. These give a good guide to the reputations of former heads of state among the group who write the history books and biographies which ultimately impact on popular opinion. Also, there is some imperfect but useful information about the relative size of American government. Budgetary data are available for the U.S. government since the Washington administration, and scholars have likewise estimated the size of the national output back to the beginning of the Republic. Accordingly, it is possible to calculate federal government expenditures as a percent of the national output throughout history.
It is reasonable to assume that government’s share of total output will grow with activist presidents, and that it will fall with presidents who are skeptical of the ability of the government to positively promote the common welfare. If presidential scholars on balance have a bias toward activism, we would hypothesize that there would be a positive relationship between the growth of the relative size of government during a presidency and the reputation of that president with the presidential scholars.
Austrian scholars tend to be cautious about the use of quantitative measures, and with good reason. Several caveats are in order before we proceed. First, the gross national product (GNP) or gross domestic product (GDP) is a statistic that is profoundly difficult to calculate with any reasonable degree of accuracy in the best of circumstances. To cite just two problems, there is much market activity that is excluded (illegal services, intrafamily transactions, etc.), and governmental output is valued at the prices government paid for inputs, which often is considerably more than the amount that consumers of governmental services value the output. The problem is compounded for earlier eras, for which data are limited.[3]
In addition, while government expenditures are but one measure of the command that the state has over the citizenry, it is not a perfect one. For example, government can establish regulatory mandates that impose enormous costs on the public but involve only modest government expenditures. A case in point: Consumers probably spend billions of dollars annually buying air bags for their cars that they otherwise would not spend. Consequently, government spending as a percent of GNP or GDP does not fully capture the impact of this mandate on our lives.
Despite these caveats (and others not mentioned), government spending as a percent of total output is probably a reasonably good proxy for government activism. If government spending as a percent of GNP is rising, government in some sense is becoming more important in our lives and is intervening in some sense to a greater extent in our economy. If such spending falls as a percent of total output, there is a strong likelihood that governmental influence in our lives is declining.
Ranking the Presidents from a Classical-Liberal-Austrian Perspective
We took data on governmental expenditures by fiscal years, as reported in Historical Statistics of the United States and other documents, and related them to estimates of total output reported by the Department of Commerce for modern times, by Simon Kuznets for a few decades around the beginning of this century, and by Thomas Senior Berry for the century between the beginning of constitutional government and 1889.[4] We have calculated federal expenditures as a percent of GNP or GDP for the entire period.[5] Figure 1 shows that there have been significant fluctuations in that statistic, with a generally strong upward trend.
We then calculated the change in government spending as a percent of GDP during the administration of each president, comparing the year prior to the inauguration of the president with the president’s last year in office. Thus in his last full year in office, 1980, Jimmy Carter presided over a government that spent 21.22 percent of the nation’s total output, compared with 20.44 percent in 1976, the year before he assumed office. Subtracting the latter figure from the former, we conclude that the federal government absorbed 0.78 percent more of the gross domestic product during the Carter presidency. Two presidents, William Henry Harrison and James Garfield, served as presidents for only a fraction of a year, and thus are excluded from our analysis.
From a classical-liberal or Austrian perspective, increases in government’s share of total output would likely be considered bad or intrusive on personal liberty, while decreases would be considered good. In Table 1, we rank the presidents solely using such a criterion, ignoring any other factor that might be used to evaluate the president. We also indicate what the ranking of the presidents was using the broadest of the conventional presidential scholar assessments, namely that conducted by Murray and Blessing, as well as a Chicago Tribune ranking compiled by Steve Neal.[6] These ratings end with President Carter. The Murray-Blessing survey involved 846 American historians belonging to the American Historical Association; the Neal study involved a self-selected group of 49 rather distinguished presidential scholars.[7] Finally, we include another recent large survey (Ridings-McIver) of about 700 political scientists which extends up to Bill Clinton.[8]
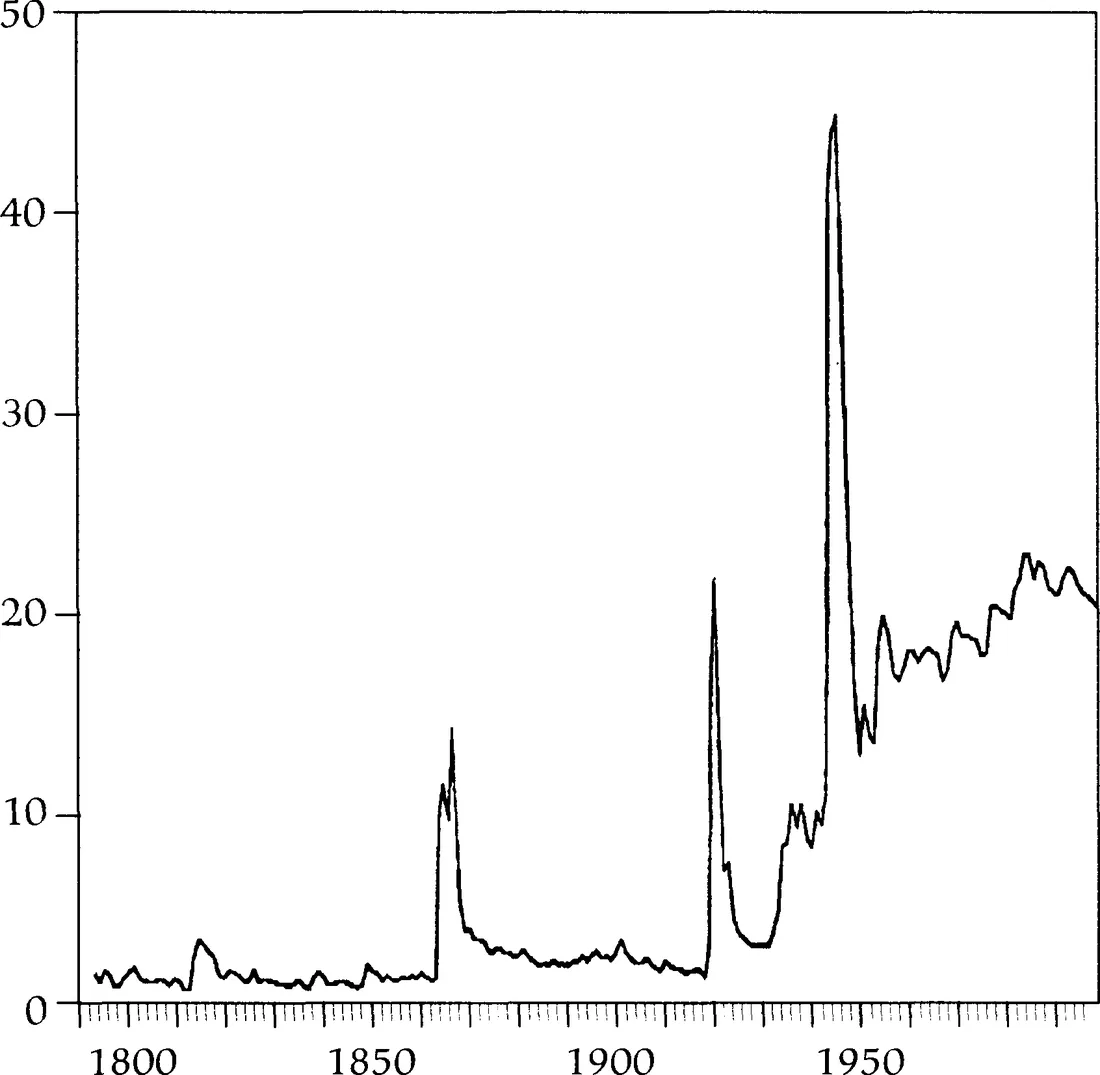
Figure 1
Federal Government Spending as a Percent of Total Output, 1792–1997
| Table 1 | |||
|---|---|---|---|
| Four Rankings of Presidential Performance (Ranked from Best [no. 1] to Worst) | |||
| Vedder-Gallaway | Murray-Blessing | Steve Neal | Ridings-McIver |
| 1. Truman | 1. Lincoln | 1. Lincoln | 1. Lincoln |
| 2. A. Johnson | 2. F. Roosevelt | 2. Washington | 2. F. Roosevelt |
| 3. Harding | 3. Washington | 3. F. Roosevelt | 3. Washington |
| 4. Clinton | 4. Jefferson | 4. T. Roosevelt | 4. Jefferson |
| 5. Nixon | 5. T. Roosevelt | 5. Jefferson | 5. T. Roosevelt |
| 6. Coolidge | 6. Wilson | 6. Wilson | 6. Wilson |
| 7. Grant | 7. Jackson | 7. Jackson | 7. Truman |
| 8. Eisenhower | 8. Truman | 8. Truman | 8. Jackson |
| 9. Washington | 9. J. Adams | 9. Eisenhower | 9. Eisenhower |
| 10. Monroe | 10. L. Johnson | 10. Polk | 10. Madison |
| 11. J.Q. Adams | 11. Eisenhower | 11. McKinley | 11. Polk |
| 12. Jefferson | 12. Polk | 12. L. Johnson | 12. L. Johnson |
| 13. Taft | 13. Kennedy | 13. Cleveland | 13. Monroe |
| 14. Taylor | 14. Madison | 14. Kennedy | 14. J. Adams |
| 15. Arthur | 15. Monroe | 15. J. Adams | 15. Kennedy |
| 16. T. Roosevelt | 16. J.Q. Adams | 16. Monroe | 16. Cleveland |
| 17. Van Buren | 17. Cleveland | 17. Madison | 17. McKinley |
| 18. Hayes | 18. McKinley | 18. Van Buren | 18. J.Q. Adams |
| 19. Buchanan | 19. Taft | 19. J.Q. Adams | 19. Carter |
| 20. Reagan | 20. Van Buren | 20. Taft | 20. Taft |
| 21. Cleveland | 21. Hoover | 21. Hoover | 21. Van Buren |
| 22. Tyler | 22. Hayes | 22. Hayes | 22. G.H.W. Bush |
| 23. Fillmore | 23. Arthur | 23. Ford | 23. Clinton |
| 24. Jackson | 24. Ford | 24. Arthur | 24. Hoover |
| 25. McKinley | 25. Carter | 25. B. Harrison | 25. Hayes |
| 26. Pierce | 26. B. Harrison | 26. Taylor | 26. Reagan |
| 27. B. Harrison | 27. Taylor | 27. Carter | 27. Ford |
| 28. Kennedy | 28. Tyler | 28. Tyler | 28. Arthur |
| 29. Carter | 29. Fillmore | 29. Coolidge | 29. Taylor |
| 30. Polk | 30. Coolidge | 30. A. Johnson | 30. Garfield |
| 31. J. Adams | 31. Pierce | 31. Fillmore | 31. B. Harrison |
| 32. Madison | 32. A. Johnson | 32. Grant | 32. Nixon |
| 33. G.H.W. Bush | 33. Buchanan | 33. Pierce | 33. Coolidge |
| 34. L. Johnson | 34. Nixon | 34. Buchanan | 34. Tyler |
| 35. Ford | 35. Grant | 35. Nixon | 35. W.H. Harrison |
| 36. Hoover | 36. Harding | 36. Harding | 36. Fillmore |
| 37. Wilson | 37. Pierce | ||
| 38. Lincoln | 38. Grant | ||
| 39. F. Roosevelt | 39. A. Johnson | ||
| 40. Buchanan | |||
| 41. Harding | |||
Before going into the specifics of the rankings, we calculated the correlation coefficient between our libertarian-oriented ratings and those involving historians and presidential scholars. The correlation coefficient between our ranking and the Murray-Blessing assessment was -0.35 and was statistically significant at the 5 percent level. The correlation between our ranking and the Chicago Tribune and Ridings-McIver rankings was a bit lower, -0.31 and -0.30, respectively. The negative correlation coefficient is interesting. Since our ranking is solely determined by the relative size of government, the results support our initial hypothesis that, other things equal, presidential historians prefer presidents who expand the relative size of the public sector. Within the presidential scholar community, there seems to be great agreement, as the correlation coefficients between the various “mainstream” rankings above is between +0.964 and +0.977.
The Founding Fathers (Washington, John Adams, Jefferson, and Madison) rank very well among presidential scholars, all above average, with Washington and Jefferson consistently in the top five. While both Washington and Jefferson rank in the top third of presidents in our initial rankings, John Adams and James Madison rank in the bottom third of presidents, as government spending expanded significantly in their administrations, with Madison presiding over the War of 1812, one of the least glorious moments in American military history by any reckoning.
Looking at the antebellum presidents (Monroe through Buchanan), our assessment of Monroe and John Quincy Adams is moderately more favorable than the scholars, but we rank Andrew Jackson sharply lower than the other scholars (see Table 1). Jackson is something of an enigma to libertarians or Austrians, who like his suspicion of central power and his successful efforts to rid America of central banking but dislike his expansionist view of the federal government and his increased spending, among other things. Our assessment of Van Buren and Tyler does not deviate radically from the presidential scholars, but that is not the case with James Polk, who consistently ranks in the top third of presidents among the scholars but makes it into our bottom ten. Again, he is an expansionist president. We rate Zachary Taylor and Millard Fillmore higher than the scholars, but share with them a generally mediocre evaluation of Franklin Pierce. Finally, we find Buchanan to be a rather average president who presided over a slight decline in government spending relative to total output, whereas the presidential scholars all view Buchanan as one of our five worst presidents.
Abraham Lincoln is revered by presidential scholars and, by most Americans, is considered the greatest president in all the surveys mentioned above, greater even than such giants as George Washington and Thomas Jefferson. In our “black box” calculations, however, Lincoln appears as America’s second worst president. Under Lincoln, the government’s role in American economic life grew to what were, up to then, unprecedented levels. The country was subjected to hyperinflation, ended links of the currency to precious metals, and introduced an income tax, as well as such nonlibertarian phenomena as military conscription and the suspension of habeas corpus rights. More importantly, it endured a massive civil war that killed more Americans than any other conflict. The robust rate of economic growth prevailing in the 1840s and 1850s ground to a halt for several years, and it took the South over a century to regain its relative economic standing. To Austrians, this is a nightmare. On moral grounds as well as the grounds of promoting free markets for labor services, Lincoln can be championed for ending slavery, but such subjective considerations did not enter into our rankings, which were purely based on the statistical evidence relating to the size of government.
Looking at the postbellum nineteenth-century presidents (Andrew Johnson through McKinley), we diverge sharply from presidential scholars with respect to the first two, Andrew Johnson and U.S. Grant, whom the scholars view as being among the worst presidents, but whom we evaluated very highly.[9] In a sense, both presidents were in the right place at the right time from the standpoint of our approach to evaluating greatness, as they presided over dismantling most of the governmental apparatus that existed during the Civil War. While government spending as a percent of total output fell sharply under both Johnson and Grant, the decline was only about two-thirds of the increase in government’s share of output that occurred during the Lincoln years. This is consistent with the notion of Robert Higgs that “crises” lead to a ratchet effect, whereby government spending rises dramatically, then declines only modestly during the subsequent return to normalcy.[10] We will return to this later. We generally like Rutherford B. Hayes and Chester A. Arthur a bit more than the presidential scholars, and Grover Cleveland and William McKinley a bit less. We are in agreement with their mediocre evaluation of Benjamin Harrison.
Turning to the first third of the twentieth century, we diverge sharply from the presidential scholars with respect to virtually every president. Theodore Roosevelt is always on the presidential scholars top-five list, but we put him near the middle. His type of activist “progressive” regulatory policies and foreign policy initiatives do not endear him to Austrian libertarian types, but do to statist-oriented presidential scholars. We like William Howard Taft a good deal more than the other scholars, but our divergence here is nothing like that in the case of Woodrow Wilson. Wilson ranked sixth in all the cited polls, but third from the bottom in our list. On his watch the income tax was enshrined in the American Constitution, the Federal Reserve was established, and more militant government intervention ensued in the private sphere (for example, new antitrust laws). And, from the standpoint of rankings, the most important fact was that the United States became embroiled in World War I, beginning the era of extensive American involvement in foreign disputes.
We evaluated Harding and Coolidge highly, placing them in the top ten. Naturally, they both are in the bottom ten in the lists of the presidential scholars, with Harding ranking dead last. While Harding’s administration was mired in scandals, they appear to be modest relative to those of the Clinton era. Moreover, taxes were slashed, and industrial production during Harding’s tragically short tenure rose over 60 percent. Furthermore, Harding let markets work to end the 1920–1921 depression. Playing golf and poker and drinking whiskey, Harding allowed the price mechanism to lower unemployment from double-digit levels when he assumed office to less than 4 percent when he died. Yet, returning to Higgs’s ratchet effects, the combined exertions of Harding and Coolidge in reducing government, while commendable, did not return us to the prewar norm. Herbert Hoover is a horse of a different color. No one seems to like Hoover, but we like him even less than the presidential scholars, putting him on our short list of worst presidents. Aside from being a pre-Keynesian big spender, Hoover interfered in major ways in labor markets, setting the stage for the Great Depression.[11] He was a meddling interventionist, a Franklin D. Roosevelt without the charisma.
In the large presidential surveys, Franklin D. Roosevelt ranks above George Washington, right behind Abraham Lincoln. In our objective evaluations, he was absolutely the worst American president. Roosevelt, more than any other man, set the stage for the modern American welfare state. We are today still grappling with problems that are part of the Roosevelt legacy, ranging from Social Security to anachronistic laws regulating labor and financial markets. Whether Roosevelt could have kept America out of World War II may be debatable, but Roosevelt’s statist legacy is significant independent of the war effort. To mainstream scholars, Roosevelt’s activism is something to be admired. Ignored are the facts that America took longer to get out of the Great Depression than any other nation, and that the median annual unemployment rate during Roosevelt’s twelve years in office exceeded 17 percent.
Turning to the postwar presidents, Harry Truman is another example of someone whose ranking benefitted from his predecessor’s profligacy. Truman is on everyone’s top-ten list, including ours. Truman presided over a sharp decline in government spending—but to nowhere near the levels relative to output prevailing in the prewar era. Truman’s reduction in government spending as a percent of total output ranks first, but that occurred despite his basic interventionist instincts. We return to this point later.
The same thing can be said for Eisenhower, whom we rank highly, similar to the mainstream scholars. His good ranking comes from the end of the Korean War. We think the scholars seriously overrate John F. Kennedy, but our divergencies regarding Lyndon Johnson and Richard Nixon are even greater. The historians think Lyndon Johnson was a very good president, no doubt because of his Great Society, which essentially is the reason we reach the opposite conclusion, ranking him, along with Gerald Ford, as the worst postwar president. Nixon, on the other hand, gets high marks from us and very low marks in the other surveys. Many presidential scholars were born and raised as Nixon-haters. Our high evaluation relates to some modest reduction in the public sector as a consequence of the end to the Vietnam War. Spending soared during Gerald Ford’s brief tenure, as he went along with a Democratic Congress’s spending spree, ostensibly to get the nation out of a severe recession.
Our ranking of Jimmy Carter is similar to that of Murray-Blessing and Steve Neal—a below-average president. Carter is rising in the rankings over time, however, and actually is slightly above the average in the Ridings-McIver poll, no doubt reflecting both Carter’s postpresidential efforts at winning popularity and the statist orientation of political scientists. Ronald Reagan is right in the middle in our rankings. While his antigovernment rhetoric was good, the actual reduction in governmental spending as a percent of GDP was extremely small. Unsurprisingly, the Ridings-McIver poll ranks Reagan well below average. George H.W. Bush ranks lower in our estimation than in the Ridings-McIver poll. Government spending grew significantly in the Bush years, as well as such other interventions as the Americans with Disabilities Act, a law raising the minimum wage, expanded civil rights legislation, and so forth.
Any evaluation of Bill Clinton must be tentative. Based on his first five years of performance, however, Clinton ranks high. Government spending as a percent of GDP has declined noticeably during his administration, although more credit probably goes to the antistatist Republican Congress elected in 1994 than to the president, a man who tried to foist a major expansion in government (the Clinton healthcare proposal) onto the American people. Interestingly, the Ridings-McIver poll gives Clinton a mediocre ranking, far below ours.
Alternative Ways of Ranking Presidents
Our rankings based on changes in government spending relative to total output can be criticized on a number of grounds, some of which we mentioned above. To begin, a shift in, say, one-half of 1 percent of the national output away from government today is not a dramatic change in the role of government in our society—after all, federal spending exceeds 20 percent of GDP Yet in the early nineteenth century, a reduction in government spending from 2 to 1.5 percent of GDP involved a very significant relative downsizing of government. Perhaps we should evaluate presidents by the percentage change in the proportion of national output absorbed by the federal government. For example, if government spending falls from 2.0 to 1.5 percent of GDP, we would consider that a 25 percent decline (1.5 is 25 percent less than 2 percent), while a reduction from 20 percent to 19.5 percent of GDP, precisely the same absolute change, is a change of only 2.5 percent—one-tenth as much. Accordingly, in Table 2, we offer a variant of the original rankings based on percentage changes in the government spending—GDP ratio.
Another problem arises because some presidents inherit a government swollen in size by a recent crisis (most often a war) and despite interventionist tendencies manage to reduce it in size. Harry Truman is the classic case in point. Accordingly, we used a different statistical approach to a third variant of presidential rankings. With ordinary least squares regression analysis, we used as our dependent variable annual government spending as a percent of GDP for the years 1792 to 1997, and introduced the inherited size of government for each president as an independent variable in the analysis, along with “dummy” variables for each president, referenced on Bill Clinton. We derived our rankings from the coefficients for the dummy variables.
The alternative approaches to presidential assessment have little impact on the rankings at the extremes. Harry Truman, Andrew Johnson, and Warren G. Harding are at the top in all variants. Likewise, Franklin D. Roosevelt, Abraham Lincoln, Herbert Hoover, and Woodrow Wilson rank in the bottom five in all rankings. Most of the modern presidents rank lower in the alternative rankings. Bill Clinton goes from 4th to 18th or 28th, for example, and Richard Nixon from 5th to 19th or 30th, that is from above average to about average (in the first variant) or into the bottom third of the presidents (second variant). Dwight Eisenhower goes from 8th to 20th or 21st in the rankings. Our own sense is these are probably more accurate statements of the contributions of these presidents from the standpoint of human liberty. Several modern presidents (for example, Gerald Ford, Lyndon Johnson, John F. Kennedy, George H.W. Bush) are viewed poorly in all variants of the rankings. In one ranking (the regression model), Ronald Reagan falls into the bottom third of all presidents, which strikes us as somewhat too harsh, as he ranks below Nixon and Lyndon Johnson.
| Table 2 | |
|---|---|
| Alternative Presidential Rankings Based on Government Size | |
| Percent Change in the Federal Government’s Share of GDP | Regression Model With Inherited Status and Dummy Variable |
| 1. A. Johnson | 1. Truman |
| 2. Truman | 2. A. Johnson |
| 3. Harding | 3. Harding |
| 4. Washington | 4. Taylor |
| 5. Coolidge | 5. Van Buren |
| 6. Grant | 6. Grant |
| 7. J.Q. Adams | 7. Washington |
| 8. Taylor | 8. Monroe |
| 9. Taft | 9. Tyler |
| 10. Jefferson | 10. Cleveland |
| 11. Monroe | 11. Jefferson |
| 12. Van Buren | 12. Fillmore |
| 13. Arthur | 13. Jackson |
| 14. T. Roosevelt | 14. Madison |
| 15. Buchanan | 15. J. Adams |
| 16. Hayes | 16. B. Harrison |
| 17. Tyler | 17. J.Q. Adams |
| 18. Clinton | 18. Arthur |
| 19. Nixon | 19. Pierce |
| 20. Eisenhower | 20. Polk |
| 21. Cleveland | 21. Eisenhower |
| 22. Reagan | 22. Hayes |
| 23. Kennedy | 23. T. Roosevelt |
| 24. Carter | 24. McKinley |
| 25. McKinley | 25. Buchanan |
| 26. Jackson | 26. Coolidge |
| 27. Fillmore | 27. Taft |
| 28. G.H.W. Bush | 28. Clinton |
| 29. L. Johnson | 29. L. Johnson |
| 30. Pierce | 30. Nixon |
| 31. Ford | 31. Kennedy |
| 32. B. Harrison | 32. Reagan |
| 33. Madison | 33. Carter |
| 34. Polk | 34. G.H.W. Bush |
| 35. Adams | 35. Wilson |
| 36. Hoover | 36. Ford |
| 37. Wilson | 37. Hoover |
| 38. F. Roosevelt | 38. Lincoln |
| 39. Lincoln | 39. F. Roosevelt |
John Adams and James Madison are viewed as bad presidents in two of our models, but slightly above average using the regression model. Andrew Jackson, who is ranked 24th and 26th in the spending models, moves up to the bottom of the top third (13th) in the regression model. Moving up even more is Martin Van Buren, who goes from a so-so 17th in the original estimation to 12th in the percentage change model to 5th in the regression model. Similar movements occur for John Tyler and Zachary Taylor, with the latter being among the top ten by either of the two alternative variant models. The regression model likewise moves Millard Fillmore into the top third of American presidents. Other presidents move less dramatically.
In the postbellum era, U.S. Grant is highly rated in all rankings, Rutherford B. Hayes is consistently in the middle, Chester A. Arthur a bit above the middle, and William McKinley consistently below the middle. In the regression model, Grover Cleveland moves from just below the median to the bottom of the top ten.
Turning to the twentieth century, the historians consistently rank Theodore Roosevelt high, while we consistently rank him in the middle third of presidents. The regression model moves Taft down out of the top third of the presidents where our other estimates put him. The nonregression spending models consistently put Coolidge in the top ten, but the regression model drops him to the bottom of the middle third of presidents.
Composite Rankings: Spending-Based Models and the Mainstream Scholars
There are arguments for and against any set of our rankings, or, for that matter, those of the mainstream scholars. In Table 3, we present a composite of both our and the mainstream rankings, ordering the presidents from best to worst by summing our three rankings shown in Tables 1 and 2 above, and by combining the rankings shown in the three polls of mainstream scholars.
The differences in the two sets of rankings are profound. For sake of discussion, let us assert that the top thirteen (or one-third) of the presidents (excluding William Henry Harrison and James Garfield) were “good,” that the middle thirteen were “average” and that the bottom thirteen were “poor.” Using that taxonomy, a majority of the presidents considered good by us using government size as the measurement of assessment were considered poor by mainstream scholars. Specifically, we are speaking of Andrew Johnson, Warren G. Harding, U.S. Grant, Zachary Taylor, Calvin Coolidge, John Tyler, and Chester A. Arthur. Almost half (six) of the presidents that the mainstream scholars considered good, we assessed as being poor: Abraham Lincoln, Franklin D. Roosevelt, Woodrow Wilson, James Polk, Lyndon B. Johnson, and James Madison. All six of these presidents by any definition were highly activist chief executives. Others on their “good” list, such as Andrew Jackson and Theodore Roosevelt, also were known for their aggressive use of presidential authority. Thus the “good” presidents as evaluated by mainstream scholars were mostly highly activist, while their “poor” president list was dominated by relative laissez-faire types such as Arthur, Taylor, Coolidge, and Harding.
Another way in which we differ from the mainstream scholars is that we tend to find most of the good presidents in the early decades of the Republic, while we evaluate the more recent presidents far less favorably. For analytical purposes, let us divide the history of the U.S. into three periods of roughly equal length: the early period encompassing the first thirteen presidents, Washington through Pierce; a middle period encompassing thirteen presidents from Buchanan through Harding; and a modern period encompassing the thirteen presidents since Calvin Coolidge.
A majority (seven) of the thirteen presidents on our “good” list came from the early period, while only two came from the modern (Coolidge and after) era. By contrast, a majority (seven) of the bad presidents came from the modern era, compared with three each in the early and middle periods. Why? In the modern era, government spending has tended to grow fairly consistently as a share of gross domestic product, and the most conservative and laissez-faire of presidents (Ronald Reagan in particular comes to mind) have done relatively little about it. In the early years of the Republic, this strong upward trend in government spending was not apparent.
| Table 3 | |
|---|---|
| Composite Rankings: Vedder-Gallaway and “Experts” | |
| Vedder-Gallaway | Mainstream “Experts” |
| 1. Truman | 1. Lincoln |
| 2. A. Johnson | 2. F. Roosevelt |
| 3. Harding | 3. Washington |
| 4. Grant | 4. Jefferson |
| 5. Washington | 5. T. Roosevelt |
| 6. Taylor | 6. Wilson |
| 7. Monroe | 7. Jackson |
| 8. Jefferson | 8. Truman |
| 9. Van Buren | 9. Eisenhower |
| 10. J.Q. Adams | 10. Polk |
| 11. Coolidge | 11. L. Johnson |
| 12. Tyler | 12. J. Adams |
| Arthur | 13. Madison |
| 14. Eisenhower | 14. Kennedy |
| 15. Taft | 15. Monroe |
| Clinton | 16. Cleveland |
| 17. J. Adams | McKinley |
| 18. Cleveland | 18. J.Q. Adams |
| 19. T. Roosevelt | 19. Van Buren |
| 20. Nixon | Taft |
| 21. Hayes | 21. Hoover |
| 22. Buchanan | G.H.W. Bush |
| 23. Fillmore | 23. Hayes |
| 24. Jackson | Clinton |
| 25. McKinley | 25. Carter |
| Reagan | 26. Ford |
| 27. Pierce | 27. Arthur |
| B. Harrison | 28. Reagan |
| 29. Madison | 29. B. Harrison |
| 30. Polk | 30. Taylor |
| Kennedy | 31. Tyler |
| 32. Carter | Pierce |
| 33. L. Johnson | 33. Coolidge |
| 34. G.H.W. Bush | 34. Fillmore |
| 35. Ford | 35. A. Johnson |
| 36. Hoover | 36. Nixon |
| Wilson | 37. Grant |
| 38. Lincoln | 38. Buchanan |
| 39. F. Roosevelt | 39. Harding |
Our time preference (to use an Austrian expression) for the earlier period was not shared as enthusiastically by the conventional historians and political scientists. They find modern presidents to be far better than we do. For example, they believe four of the good presidents come from the modern period, compared with two for us. We believe seven of the bad presidents come in the modern era, compared with their three.
Taking Inflation into Account Final Rankings
Any mechanistic procedures for evaluating presidents based on a single, albeit important, criterion is bound to have deficiencies. We do not really believe, for example, that Harry Truman is the best of all presidents, although we would agree that such presidents as Franklin D. Roosevelt and Woodrow Wilson are probably about as bad as the rankings indicate. One important factor that is not included in the above rankings is measurable, however; namely price stability. While we have made the equivalent of a respectable, if modest, scholarly career out of pointing out deficiencies in price indices, they nonetheless crudely approximate changes in the purchasing power of currency Most economists, and virtually all free-market oriented ones, would argue that price inflation is typically a bad thing. Five percent inflation annually is worse than 1 percent inflation, which in turn is worse than overall price stability.
The institutional arrangements governing our monetary system have varied substantially over time, and with that the president’s ability to effect stability. Over a majority of the history of the nation, some form of central bank (for example, the Second Bank of the United States, the Federal Reserve System) has played a significant role in the creation of money, and that bank usually has had a fair amount of independence from the president. Nonetheless, the central bank itself is a creation of the government, and typically the president has made key appointments of personnel to the bank (for example, the chairman and members of the Board of Governors of the Federal Reserve System). Moreover, the president has been influential in other ways in influencing prices, such as Lincoln’s support of the issuance of greenbacks (fiat paper money) during the Civil War, or through their policies on the role of gold and silver in the monetary system. For example, both Franklin D. Roosevelt and Richard Nixon took steps to essentially eliminate gold as a medium of exchange.
While most economists with an appreciation of the powers of markets in allocating resources would agree that inflation is bad, there is some division of opinion on what is the optimal policy regarding the purchasing power of money. Austrians tend to look with great disdain on the discretionary creation of money by central banks, even if that creation is associated with price stability as measured by price indices. To Austrians, such increases in the supply of money lead to a divergence of money interest rates from the true rate of time preference, or of what Wicksell called the “natural rate” of interest. The classic case of inappropriate monetary manipulation occurring within an environment of measured price stability was in the 1920s.[12]
From that perspective, a zero rate of reported inflation is not necessarily good. Austrians would probably in general applaud the moderately deflationary monetary record of the last third of the nineteenth century during the heyday of the classical gold standard, for example, and would have condemned a “stable price” monetary policy in that period that augmented monetary growth induced by increased gold stocks with paper money creation in order to maintain price stability in some version of the consumer price index. In our “variant 1” in Table 4, a negative rate of inflation is considered good, and the more negative the inflation rate, the better.[13]
In variant 2 in Table 4, we assume that the “optimal” amount of measured inflation is zero, and that ideally the nation is best served by having currency that maintains its purchasing power at a constant rate over time.[14] It can be argued that information costs of understanding the signals generated by markets are lower during periods of aggregate price stability. Under this scenario, the “best” presidents from a monetary policy perspective are the ones who maintain price stability, and 5 percent annual deflation (which occurred, for example, under Herbert Hoover) is as bad as 5 percent annual inflation (which occurred, for example, under Ronald Reagan). Since negative rates of inflation occurred during thirteen presidencies, these alternative views on appropriate monetary policy lead to somewhat different results.
| Table 4 | |
|---|---|
| Rankings Based on Size of Government and Inflation* | |
| Variant 1 | Variant 2 |
| 1. Harding | 1. J.Q. Adams |
| 2. A. Johnson | 2. Jefferson |
| 3. Grant | 3. Taylor |
| 4. Monroe | 4. J. Adams |
| 5. Van Buren | Coolidge |
| 6. Taylor | 6. Buchanan |
| 7. Jefferson | 7. Fillmore |
| 8. Arthur | 8. Jackson |
| 9. Tyler | 9. Grant |
| 10. J.Q. Adams | Cleveland |
| 11. Hayes | 11. Tyler |
| 12. Cleveland | 12. A. Johnson |
| 13. Coolidge | McKinley |
| Truman | Eisenhower |
| 15. J. Adams | 15. Arthur |
| 16. Polk | 16. Van Buren |
| Buchanan | 17. B. Harrison |
| Hoover | T. Roosevelt |
| 19. Eisenhower | 19. Truman |
| 20. Fillmore | 20. Taft |
| 21. Jackson | 21. Monroe |
| 22. Washington | 22. Madison |
| 23. T. Roosevelt | 23. Washington |
| 24. Taft | 24. Clinton |
| 25. McKinley | 25. Hayes |
| 26. B. Harrison | 26. Kennedy |
| 27. Clinton | 27. Pierce |
| 28. Madison | 28. Harding |
| 29. Nixon | 29. Polk |
| 30. Pierce | 30. Nixon |
| Kennedy | 31. Reagan |
| 32. Reagan | 32. L. Johnson |
| 33. L. Johnson | 33. F. Roosevelt |
| 34. G.H.W. Bush | 34. G.H.W. Bush |
| 35. F. Roosevelt | 35. Ford |
| 36. Carter | Carter |
| 37. Ford | 37. Wilson |
| 38. Wilson | 38. Hoover |
| 39. Lincoln | 39. Lincoln |
*See text for explanation; both variants based one-half on size of government considerations and one-half on price stability-inflation considerations.
Before presenting the rankings, several caveats must be stated. Aggregating price changes into an index is an exercise fraught with peril. It is doubly a problem in the earlier era when systematic price data were not collected by a small army of bureaucrats as is the case today. Problems of quality change, weighting, changing relative price effects, and other issues make it prudent to treat any findings with caution.[15] Nonetheless, as indicated earlier, these price indices are probably roughly right—they report huge inflation during the administrations of Lincoln, Wilson, and Truman, for example, and even the most orthodox Austrian would agree that such inflation in fact did occur, despite deficiencies in price indices.
In Table 4, we report our rankings of presidents with an inflation adjustment. We took the rankings in Table 3, added the numerical rank based on the rate of inflation, and then ranked the presidents based on the numeric sum of the two numbers (the lower the number, the better the perceived performance). Implicitly, we are putting an equal weight on size-of-government and price stability considerations. As discussed above, variant 1 assumes that measured deflation is preferable to perfect price stability, while variant 2 considers perfect price stability as optimal.
Turning to the variant 1 (which we suspect many Austrians would find preferable), six presidents move at least ten ranks from that reported in our rankings based on the size-of-government consideration alone (Table 3). Harry Truman goes from 1st (which we are subjectively uncomfortable with) to tied for 13th. Because of the lifting of World War II price controls in 1946, the reported inflation rate is probably too high for Truman, and too low (because of the price controls) for Roosevelt.[16] Two other presidents fall dramatically on the basis of high reported inflation: George Washington goes from 5th to 22nd, which may be very unfair given the particularly dubious quality of the data in that era, and Bill Clinton goes from being tied for 15th to 27th, which we subjectively view as very fair indeed. Three presidents move up in the rankings substantially. James Polk goes from being tied for 30th to being tied for 16th, that is, from being clearly in the list of “bad” presidents to being one that might be called roughly average. The same thing happens even more dramatically to Herbert Hoover, who moves from 36th to 18th. The high recorded deflation of the Hoover era is viewed as a sign of a highly inspired monetary policy, a view that to our knowledge is actually espoused by no economist, living or dead. Even with this decidedly pro-Hoover interpretation, he barely is above the median for all presidents. Last, the moderate deflation of the Hayes presidency helps him move from 21st to 11th in our rankings.
In variant 2, monetary greatness depends on achieving price stability. Compared with our rankings in Table 3, fully thirteen (one-third) of the presidents move dramatically in the rankings. John Quincy Adams moves from 10th to 1st. Others moving up importantly include John Adams (17th to 4th), Millard Fillmore (23rd to 7th), James Buchanan (23rd to 7th), Andrew Jackson (24th to 8th), William McKinley (tied for 25th to 12th), and Benjamin Harrison (27th to 17th). Moving down in the rankings in a significant fashion are Washington (5th to 23rd), Harding (3rd to 28th), Andrew Johnson (2nd to 12th), Harry Truman (first to 19th), James Monroe (7th to 21st), and Richard Nixon (20th to 30th).
With either set of inflation-related rankings, the modern presidents fare poorly. Using variant 1, eight of the thirteen worst presidents are from the modern era (defined as from Coolidge to the present); in variant 2, seven of the worst come from this period. None of the top ten presidents in either list is from the modern era. The inflation associated with the era of Keynesian economics leads to relatively low evaluations of modern presidents.
Comparing the two variations of the inflation adjustment, most of the bad presidents are the same in both cases. Looking at the best presidents, four are in the top ten in both lists: Thomas Jefferson, John Quincy Adams, Zachary Taylor, and U.S. Grant. Warren Harding, James Monroe, Martin Van Buren, and Andrew Johnson drop sharply in rankings in the second variant that evaluates deflation negatively. In the first variation, Herbert Hoover is slightly above average; in the second variation, he is America’s second worst president.
Presidential Performance and Political Affiliation
The mainstream scholars are largely liberal and probably mostly vote for Democratic Party candidates for president. Conventional wisdom suggests that Republican candidates tend to favor smaller government and sound money, so our classical-liberal rankings should be expected to give higher assessments of Republican presidents than Democrats. Examining the presidents since 1860, when the first Republican was elected (Lincoln), we can look at the party affiliation of the twenty-four presidents who were Republicans or Democrats. (Andrew Johnson was not a member of either party at the time of his election to the vice presidency in 1864.)
Looking first at the mainstream scholar evaluations (from Table 3), let us arbitrarily give the grade of A to the top eight ranked, B to the second eight, etc. The mainstream scholars give three Democrats As (Franklin D. Roosevelt, Wilson, and Truman), three Bs (Lyndon Johnson, John F. Kennedy, and Grover Cleveland), one C (Clinton) and one D (Carter), for a cumulative grade point average (on a 4.0 scale) of 3.0, or a B average.
The mainstream evaluation of Republicans is far more negative. The only As go to activists Lincoln and Theodore Roosevelt. Eisenhower, Arthur, and McKinley get Bs, while Hayes, Taft, Hoover, and G.H.W. Bush get Cs. The experts give three Ds, to Ford, Reagan, and Benjamin Harrison. While no Democrats are considered failures, four Republicans are: Coolidge, Nixon, Grant, and Harding. The cumulative average is 1.75, about a C-, dramatically below the B average given Democrats. The Democratic-interventionist bias of the so-called experts seems confirmed.
In Figure 2, we show our distribution of grades (using the same grading scale as above) for Republican and Democratic presidents, using variant 1 of Table 4 (taking into account inflation) as our measure. Our distribution of grades of Republicans is almost even across the board, with three at every level except D. As go to Harding, Grant, and Arthur; Bs to Hayes, Coolidge, and Hoover; Cs to Eisenhower, Theodore Roosevelt, and Taft; Ds to McKinley, Benjamin Harrison, Nixon, and Reagan; and Fs to G.H.W. Bush, Ford, and Lincoln. The cumulative grade point average is a lowly 1.93, a little below a C average, and below the average of all presidents (including the antebellum ones before the modern two-party system is fully established). So much for the possible pro-Republican bias of our rankings. Indeed, the evidence here seems to show that Republicans are not overwhelmingly supportive of principles of small government and sound money, their rhetoric notwithstanding. No Republican in the past two-thirds century received a grade above C.
At the same time, however, our assessment of the Democrats is even more scathing, as Figure 2 shows. There are no As, Cleveland and Truman getting B. While Clinton and Kennedy eked out passing grades (Ds), fully four presidents were given failing grades: Lyndon Johnson, Franklin Roosevelt, Jimmy Carter, and Woodrow Wilson. The cumulative average is 1.0, or a D. While it is true that we find the Republicans on average to be better than the Democrats, modern presidents of either political affiliation have tended to be mediocre, Democrats somewhat more so than Republicans.
Republican Presidents
Democratic Presidents
Figure 2
Vedder-Gallaway “Grades” for Presidents, by Political Party, Based on Table 4, Variant 1
Additional Observations
The rankings above are based on the size of government and, in Table 4, on the presence of inflationary or deflationary conditions. There are numerous other things that could be used to evaluate presidents—for example, the growth in real income per capita or the level of tariffs. Unfortunately, the data on these (and most other possible additional variables) are not available in a reliable enough form for us to feel comfortable with their use over the entire two-century sweep of American history.
The purpose of these rankings is to call into doubt the subjective evaluations of so-called experts on the presidency, a group dominated by individuals with a bias toward state intervention. From the standpoint of the philosophy that “the best government is the one that governs least,” conventional wisdom is severely wanting. That wisdom considers Warren G. Harding, U.S. Grant, and Chester A. Arthur to be mediocre or bad presidents. Our assessment (using variant 1 of Table 4) evaluates these men as very good presidents. Conventional wisdom suggests that Lincoln, Franklin D. Roosevelt, Woodrow Wilson, and Lyndon Johnson were very good or great presidents; our rankings puts these activist chief executives in the bottom ten.
At the same time, we do not consider these rankings infallible. The performance of presidents depends on factors other than government expenditure size and inflationary trends. There are issues of integrity and character, adeptness in foreign policy, and so forth. Our own subjective evaluations, while highly correlated in a positive direction with those reported in either Table 3 or Table 4, are somewhat different than those reported. We believe, for example, that Ronald Reagan was a better president than Richard Nixon or Bill Clinton, the quantitative evidence cited above notwithstanding. We do not think the totality of evidence suggests that Lincoln is about our worst president or, using Table 4, that George Washington was a mediocre one.
One thing that is striking, looking at the evidence: It takes several good presidents to undo the damage caused by one bad one. The Higgs spending ratchet, cited earlier and visually observable in Figure 1, is a very powerful force in American history. The first ratchet effect occurs with James Madison and the War of 1812. Federal spending goes from 1.23 percent of total output in 1811 (the lowest level ever recorded) to 3.87 percent two years later—more than a tripling. We never returned to the 1811 level, and it took eighteen years and three presidents to get us more than 90 percent of the way back in 1831. In 1860, spending was 1.59 percent of GDP, more than quintupling during the war (and our statistics understate the total, since Confederate spending is not included). In 1912—fifty-two years after the previous trough—spending had returned about 97 percent of the way back to that trough, to 1.75 percent of GDP We never completely returned to the antebellum spending norm, and it took decades to even approach it.
The second decade of the twentieth century is often underrated in terms of the destructive impact that it had on human liberty in the United States. Spending as a percent of GDP rose from 1.75 percent of GDP in 1912 to over 19 percent in fiscal year 1919. While it fell back to slightly over 3 percent in the Coolidge administration (over 90 percent of the way back to the prewar trough), again it never quite reached the prewar level (and it took a decade to even partially recover). The Hoover-Roosevelt surge in spending, the next great ratchet, was followed by some decline in the Truman era, but, unlike after earlier ratchets, the drop was nowhere near 90 percent or more of the way back to the prewar trough. While some may blame this on the cold war, the rise in nondefense spending and the modern welfare state is the chief culprit. Fifty years ago, in 1948, federal government spending was less than 12.7 percent of GDP—now it is around 20 percent. The downward drift in the federal spending-output ratio, present during most of peacetime history, seems to have disappeared. The modest drop in that ratio since 1982 is tepid indeed in terms of returning to the postwar (1948) level. The decline in fiscal restraint associated with the breakdown in the unwritten fiscal constitution of balanced budgets existing in the pre-Keynesian era has assisted in the erosion of individual liberty.[17]
There is also some evidence of an inflationary ratchet effect in the post-Keynesian era. Beginning in 1933, prices have risen rather consistently, never falling for more than two consecutive years. While there has been some healthy popular revulsion developing in recent years against the use of inflationary fiscal and monetary stimulus, we have not had a single year of stable prices in any presidential administration since John F. Kennedy, even allowing for possible distortion in the consumer price index.
Further Evidence on the Higgs Ratchet Effect
The phenomenon of the Higgs ratchet deserves a more in-depth treatment. We have performed an econometric analysis to determine the impact of previous peak levels of federal government spending on the current volume of outlays. The overall results are consistent with the Higgs hypothesis. On average, federal government spending is ratcheted upward by almost 40 percent of the previous peak level of spending. Thus, the long-term effects of a surge in federal spending to new heights are indeed profound. We have also explored the individual impacts of the spending peaks reached in specific presidencies. Six presidents established new highs for federal spending: Washington (since he was the first president), John Adams, Madison, Lincoln, Wilson, and Franklin Roosevelt. The ratchet effects of the first two of these, Washington and Adams, are not statistically significant. However, the last four are, and they provide some revealing insights into the impact of extremely high levels of federal government spending.
Table 5 provides summary statistics concerning the four significant ratchets. The econometric analysis allows us to calculate the permanent effects of these four presidents on the level of federal government spending. The Madison ratchet contributes 0.81 percentage points, Lincoln 2.39, Wilson 4.72, and Franklin Roosevelt 9.93. Collectively, the impact of these four presidents amounts to 17.85 percent of national output, over 88 percent of the 1997 level of spending. This is the permanent legacy of the profligacy of the past. It is remarkable to note that, though he died over fifty years ago, to this day Franklin Roosevelt is still appropriating one dollar of every ten dollars of national output to be used by the federal government establishment. In a sense, all of us tithe to the memory of this man.
War and Peace
A clear pattern emerges from the discussion of the ratchet effects. The four statistically significant ones are associated with the phenomenon of war, in sequence, the War of 1812, the Civil War, and the two world wars. Further, there is a pronounced association between major wars and the presidential rankings offered by both the mainstream experts and us. The average expert ranking of the four presidents associated with the war-induced ratchets is 5.5, with Madison being the lowest, ranked at 13th. On the other hand, we rank these four on average at 35.6. More generally, the mainstream scholars liked virtually all war presidents, including ones presiding over other wars, such as James Polk, William McKinley, and Lyndon Johnson. Indeed, the experts universally ranked high all the presidents in office during what might be called the high cold war, from 1945 to about 1968.
To the extent that presidents try to maximize their perceived historical legacy, the prowar bias of the conventional historians and political scientists suggests that at the margin some wars may be fought to enhance presidential reputation rather than to right wrongs or maximize the national interest.[18] In making a cost-benefit calculation whether to engage in war, presidents might consider the private benefit they receive from a probable enhancement in their presidential reputation. Wars make presidents look heroic, and everyone loves a hero. Indeed, wars are responsible for the election of many presidents, beginning with George Washington, and including Zachary Taylor, U.S. Grant, and, more recently, Dwight Eisenhower.
| Table 5 | ||||
|---|---|---|---|---|
| Selected Statistics Relating to Impact of Previous Peak Federal Spending Levels Established During Administrations of Four Presidents | ||||
| Statistic | President under Whom Ratchet is Established | |||
| Madison | Lincoln | Wilson | Franklin Roosevelt | |
| Number of Years Ratchet in Effect | 50 | 56 | 25 | 54 |
| Mean Federal Spending During Ratchet | 2.00% | 3.41% | 9.03% | 20.36% |
| Mean Value of Ratchet Variable | 3.84% | 11.55% | 21.80% | 46.02% |
| Recovery Factor | 39% | 69% | 54% | 59% |
| Long-Term Impact on Federal Spending* | +0.81 | +2.39 | +4.72 | +9.93 |
Source: Authors’ Calculations
* Measured in percentage points.
Should the experts exalt wartime leaders or should we denigrate them? We think the weight of the evidence on this issue is on our side. While it may be inappropriate to assign complete responsibility for the advent of war to the nation’s chief executive when hostilities occur, neither is treating the onset of war as a random event warranted. War does not occur in a vacuum. It is the culmination of a series of public-policy positions either avowed or pursued prior to its outbreak. In the case of the American Civil War, for example, the very persona of the newly elected president, Abraham Lincoln, was a contributing factor in accounting for the commencement of hostilities. As to World War I, a significant degree of responsibility for our entry into that conflict has to be assigned to the president who campaigned for reelection in the summer and fall of 1916 invoking the slogan, “He kept us out of war,” and then, in a remarkable about-face, some five months after the election stood before the Congress asking for a declaration of war against Germany.
Things are not as clear-cut in the case of World War II, but the Japanese attack on the naval base at Pearl Harbor did follow a series of policy initiatives that escalated tension between Japan and the United States, a set of circumstances for which Franklin Roosevelt does bear the responsibility.[19]
Of course, war impacts on our presidential rankings by increasing the level of federal spending. However, such surges in spending are not permanent. Or are they? Whatever the reason for government spending, it diverts resources from the private sector of the economy. In the process, the public must become accustomed to a lower level of private consumption. Customarily, this is regarded as acceptable in the name of patriotism or some other civic virtue. At the conclusion of hostilities, this period of public sacrifice is over and there exists what has come to be called a “peace dividend” that may be “spent.” The operative word here is “spent.” The simplest thing to do with a peace dividend is to return it to the public to be used in the pursuit of its private consumption. However, once resources have passed under the control of the central government, it is often difficult to retrieve them. To be sure, some of the peace dividend will be returned to the private sector. But much of it will be retained in the public arena to do “good works”; that is, to enhance social spending. A large pool of public resources is an irresistible attraction for what Mancur Olson has called the “distributional coalitions” in a society.[20] To the extent they are able to capture a portion of the peace dividend for their special-interest purposes, the volume of public spending will be maintained at levels that are greater than the prewar ones.[21] This is the Higgs ratchet.
The phenomenon of the ratchet disguises the permanence of the impact of war by transforming military spending into social outlays. Thus, the ratchet effects attributable to the Madison, Lincoln, Wilson, and Franklin Roosevelt presidencies are still with us today in the form of higher taxes, either explicit or implicit, that have funded a remarkable expansion of social programs. Therefore, our downgrading of the presidential performance of those who were wartime leaders would seem to be appropriate. To illustrate the magnitude of these effects, Figure 3 shows the contributions of the four wars that produced significant ratchet effects to current levels of federal government spending, which amounted to slightly over 20 percent of GDP in 1997. This figure dramatically demonstrates the long-term costs of war to a society.[22]
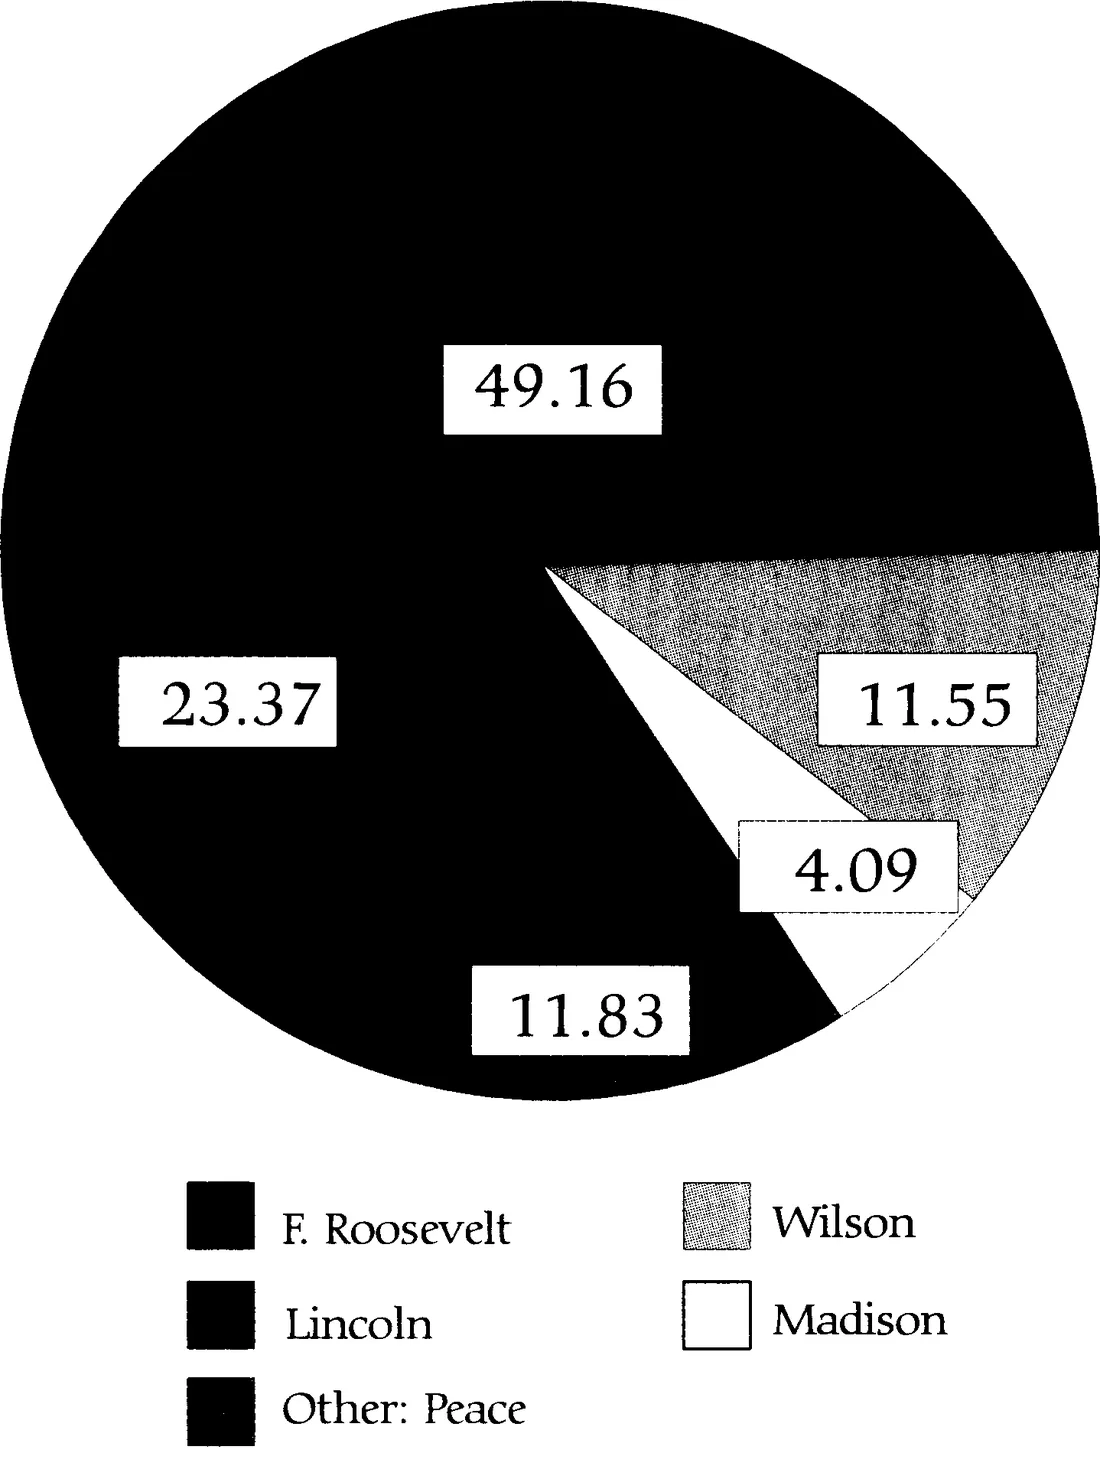
Figure 3
War and Peace Percent of Federal Spending Attributable to War Presidents
Conclusions
Individual happiness is not created in large part through the actions of political leaders. The dynamic, chaotic market processes of individual human economic actions have had far more to do with America’s material prosperity and happiness than the behavior of any president. Yet bad political leaders can have lasting negative consequences. The half-life of the adverse consequences of ill-considered political activism is long.
Classical-liberal scholars should ponder why this is so. Why cannot or did not, say, a Ronald Reagan do much to roll back government? Why has the seemingly promising laissez-faire behavior of the 94th Republican Congress (1995–1996) not been followed by a really substantial retreat of government, rather than the tepid (although still welcome) amounts observed to date? Insights by Austrian and public-choice scholars on the nature of government, bureaucracies, special interest groups, and so forth help us pave the way to finding answers to these questions.[23] One of the “special interest groups” is academia, and its government-funded prointerventionist bias, as demonstrated in the mainstream presidential performance polls. It contributes to the reluctance of presidents to be decisive in reducing the federal role in our affairs. In striving to please the academic mandarins evaluating the presidency, modern chief executives have stimulated the growth of Leviathan and the nanny state.
[1] Dick Morris, Behind the Oval Office: Winning the Presidency in the Nineties (New York: Random House, 1997).
[2] Richard Nixon liked to discuss presidential leadership with world leaders. For example, he had a lengthy conversation about Lincoln and his greatness with Chou En-lai during his first China visit. See Richard Nixon, The Memoirs of Richard Nixon (New York: Grosset and Dunlap, 1978), pp. 577–78. Discussions of the relative performance of past leaders, both in the U.S. and in the world, were common with key staff personnel. See, for example, H.R. Haldeman, The Haldeman Diaries: Inside the Nixon White House (New York: G.P. Putnam’s Sons, 1994), p. 227. Harry Truman was an amateur historian who ruminated considerably on the performance of his predecessors. See Harry S. Truman, Memoirs By Harry S. Truman, vol. 2, Years of Trial and Hope (Garden City, N.Y.: Doubleday, 1956), pp. 191–204. No one takes a back seat to Lyndon Johnson in being absorbed by his role in history. As Michael Beschloss says,
So seized was Johnson by the historical and managerial importance of secretly recording his conversations that on his first night as president, despite all his other worries, he apparently had the presence of mind to ensure that his first conversations in his new job were captured on a . . . taping system. (Taking Charge: The Johnson White House Tapes, 1963–64 [New York: Simon and Schuster, 1997], p. 548)
[3] See, for example, Richard Vedder, “Statistical Malfeasance and Interpreting Economic Phenomena,” Review of Austrian Economics 10, no. 2 (1997): 77–89.
[4] Our output data were obtained from Thomas S. Berry, Production and Population Since 1789: Revised GNP Series in Constant Dollars (Richmond, Va.: The Bostwick Press, 1988), U.S. Department of Commerce, Bureau of the Census, Historical Statistics of the United States, Colonial Times to 1970 (Washington, D.C.: U.S. Government Printing Office, 1975), and the Economic Report of the President, various years.
[5] Before 1929, the measure of output used is gross national product. From 1929 to the present, the U.S. Department of Commerce has calculated gross domestic product, which we use. The difference between GNP and GDP is typically very small, less than 1 percent.
[6] Robert K. Murray and Tim H. Blessing, Greatness in the White House: Rating the Presidents, Washington Through Carter (University Park: Pennsylvania State University Press, 1988) and Steve Neal, “Our Best and Worst Presidents,” Chicago Tribune Magazine (January 10, 1982).
[7] The original ranking of presidents was conducted by Arthur M. Schlesinger, Sr. His last poll appeared as “Our Presidents: A Ranking by 75 Historians,” New York Times Magazine (July 29, 1962). The poll stops with President Eisenhower and thus is viewed as too dated for discussion here.
[8] William J. Ridings and Stuart B. McIver, Rating the Presidents: A Ranking of U.S. Leaders, from the Great and Honorable to the Dishonest and Incompetent (Secaucus, N.J.: Carol Publishing Group, 1997).
[9] Another surprising admirer of Andrew Johnson was Harry S. Truman, who referred to him as “one of the most mistreated of all Presidents.” See his Memoirs, vol. 2, p. 197.
[10] Robert Higgs, Crisis and Leviathan: Critical Episodes in the Growth of American Government (New York: Oxford University Press, 1987).
[11] See Murray N. Rothbard, America’s Great Depression (Auburn, Ala.: Mises Institute, 2000), especially chaps. 7 and 8, or Richard Vedder and Lowell Gallaway, Out of Work: Unemployment and Government in Twentieth-Century America, updated ed. (New York: New York University Press, 1997), especially chap. 5. Government spending as a percent of GDP rose dramatically during the Hoover administration, far more than during the first two (prewar) terms of Franklin D. Roosevelt.
[12] See Rothbard, America’s Great Depression, chap. 4.
[13] Another approach would have been to look at some measure of monetary aggregates, or of paper money created by government fiat, or bank credit expansion. Unfortunately, good monetary statistics are not available for the earlier decades under examination.
[14] Still another option would be to look at the variations in the rate of inflation, taking the view that any given inflation, if highly predictable, will be anticipated by economic agents, reducing if not eliminating most of the adverse effects of the inflation.
[15] A special problem exists for the Washington and Adams administrations. We used the consumer price index (CPI) as reported by the Bureau of Labor Statistics, U.S. Department of Labor. That index starts in 1800. We correlated the Warren-Pearson index of wholesale prices against the aforementioned CPI for the years 1800 through 1830, and then used that regression to predict values of the CPI for the years 1788 through 1799, which we then used in our rankings. Data used were obtained in Historical Statistics and the 1997 Economic Report of the President.
[16] Truman wanted to continue price controls and vetoed the bill continuing them on the grounds that it was too weak. This left the nation with no price-control law. Repressed inflation came out into the open in 1946. Correcting for this problem, however, would not dramatically change the rankings of Truman or Roosevelt.
[17] On this point, see James M. Buchanan and Richard E. Wagner, Democracy in Deficit: The Political Legacy of Lord Keynes (New York: Academic Press, 1977).
[18] This does not only apply to recent presidents. James Polk seemed to want a little war with Mexico to enhance his standing, but instead ended up with a bigger conflict than he expected. See Paul Johnson, A History of the American People (New York: HarperCollins, 1997), p. 380, for more details.
[19] Even mainstream historians criticize the Roosevelt administration for failing to heed signals that Japan was ready to attack the United States. See, for example, Gordon W. Prange, At Dawn We Slept: The Untold Story of Pearl Harbor (New York: McGraw-Hill, 1981).
[20] See Mancur Olson, The Rise and Decline of Nations (New Haven, Conn.: Yale University Press, 1982), for a more extended discussion of this point.
[21] For a more extended discussion of the peace dividend, and the historical experience relating to the ending of wars, see Dwight Lee and Richard Vedder, “The Political Economy of the Peace Dividend,” Public Choice 88 (1996): 29–42.
[22] For an excellent extended discussion of the cost of wars to American society, see John V. Denson, ed., The Costs of War: America’s Pyrrhic Victories (New Brunswick, N.J.: Transaction Publishers, 1997).
[23] See, for example, Ludwig von Mises, Bureaucracy (New Rochelle, N.Y.: Arlington House, 1969); William Niskanen, Bureaucracy and Public Economics (Brookfield, Vt.: Edward Elgar, 1994); and Thomas E. Borcherding, ed., Budgets and Bureaucrats: The Sources of Government Growth (Durham, N.C.: Duke University Press, 1977).
Reassessing the Presidency: The Rise of the Executive State and the Decline of Freedom
Read the whole book online · Book details
This work is published under a Creative Commons licence. You may copy, share, and re-host it with attribution.